How Cannabis Vape Brands Can Protect Margins During Price Compression in 2026
Topics in this article:
Stay Profitable During Cannabis Price Compression
Last Updated: Sep 7, 2026
Price compression is no longer a cyclical problem to wait out. In 2026, it is the operating environment. For brands trying to stay profitable during cannabis price compression, the winning move is not broader discounting. It is tighter product strategy: lower real operating cost, smarter margin-tier architecture, and stronger value perception at the shelf.
That matters especially in vape and extract-heavy categories, where unit economics can still be protected if hardware decisions are treated as strategic, not administrative.
For cannabis vape brands, the practical question is simple: which product decisions still protect margin when wholesale and retail prices keep moving downward? The answer is to audit total cost of ownership, assign every hardware format a clear profit role, and use design to defend perceived value before the shopper compares price alone.
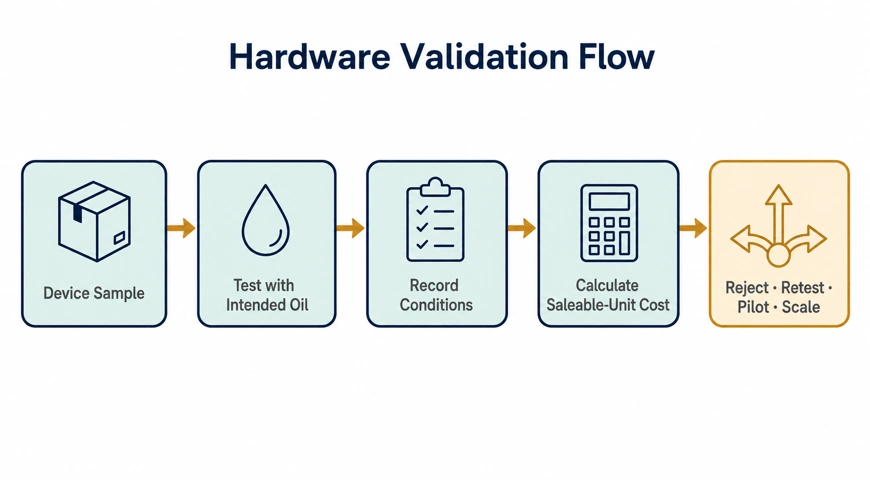
In practical terms, brands need a three-part discipline: calculate hardware cost per saleable unit, validate every device with the intended oil and operating conditions, and give each SKU one measurable portfolio job. This approach does not guarantee a higher margin. It gives product, procurement, and operations teams a shared method for identifying where margin is being earned, lost, or merely assumed.
Why Cannabis Price Compression Is Structural in 2026
The core reality is simple: price pressure has become structural. California’s 2025 market outlook says licensed businesses have faced challenging conditions since 2021, with inflation-adjusted wholesale prices in Q4 2024 down 57% versus Q4 2020, while retail prices also kept falling through the first half of 2024.
Oregon’s 2025 legislative report shows the same pattern: 2024 brought the state’s largest harvest on record, demand was estimated at just 57% of annual supply, and flower hit its lowest retail median price per gram since legalization at $3.75.
Oversupply: Oregon’s 2024 harvest exceeded modeled demand in most scenarios, and the OLCC explicitly ties that imbalance to lower prices and tighter business margins.
Gray-market and illicit competition: California estimates average annual unlicensed production at 11.4 million pounds, versus roughly 1.4 million pounds of licensed production in 2024. The same report estimates the licensed market captured only about 38% of statewide consumption in 2024.
Rising taxes: California reports that local taxes, fees, and restrictions can push the effective local tax burden above 30% for licensed operators. In Illinois, adult-use cannabis can face purchaser excise tax rates up to 25%, plus the general 6.25% sales tax and additional local cannabis taxes, with municipal and county rate changes taking effect on January 1, 2026.
The takeaway is not that the market is broken. It is that margin now has to be engineered. Brands that keep treating hardware, packaging, and assortment as downstream procurement choices will keep absorbing compression instead of managing it.
The Margin Levers Cannabis Brands Can Still Control
Complaining about taxes, enforcement gaps, or state-by-state fragmentation does not restore margin. Product strategy does. The brands with the best chance to outperform in 2026 are focusing on two controllable levers: supply-chain efficiency and product-line differentiation.
That shift is especially relevant in cannabis vape and other inhalable formats. California’s market report shows vape cartridge unit sales rose 15.9% in 2023 even while total retail value fell because prices per unit were dropping. In practice, hardware choice affects more than shelf appeal. It changes filling speed on the line, the frequency of clogging complaints, the amount of oil lost in handling, and how often a brand must replace failed units after sale.
The market data establishes demand and price context; it does not prove that a particular device will improve profitability. That conclusion must come from product-specific operating data. A brand can control how it measures filling labor, process loss, damaged stock, customer-service handling, replacements, and inventory complexity—even when it cannot control wholesale prices or state tax policy.
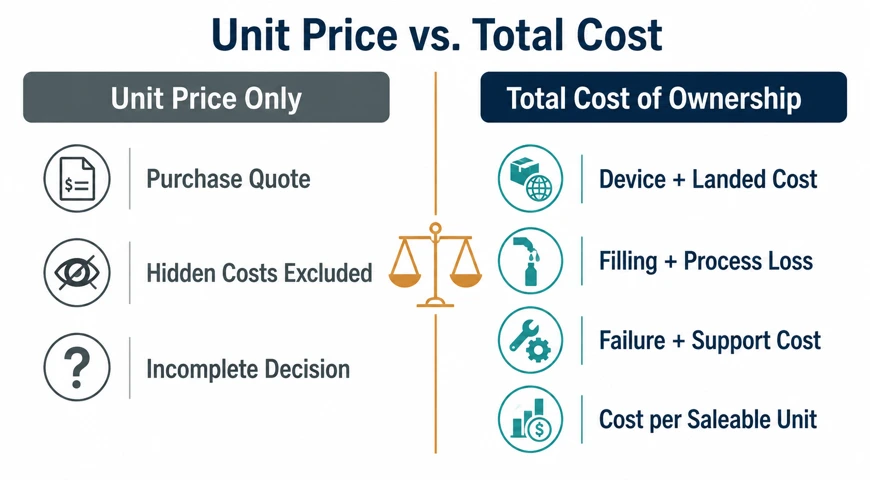
Strategy 1: Use TCO Instead of Unit Price to Choose Vape Hardware
In a price-sensitive market, the cheapest hardware SKU often creates the most expensive business outcome. A low unit price means little if the platform creates leaks, clogging, breakage in transit, slow filling, or elevated RMA rates. That is exactly the wrong place to lose money when wholesale prices are already compressed and legal operators are carrying higher compliance costs than unlicensed competitors.
For a fair comparison, calculate TCO on the same denominator:
TCO per saleable unit = device purchase cost + filling labor + process loss + damaged-inventory cost + replacement cost + customer-service handling cost.
Lost revenue should be added only when the brand has evidence connecting a hardware problem to refunds, account churn, or repeat-purchase behavior. Otherwise, it should remain a separate risk indicator rather than a manufactured cost. The objective is not to make the higher-priced option look better; it is to compare candidates using the same cost categories, test period, oil, batch size, and failure definition.
TCO component
What to record
Why it matters
Evidence boundary
Device cost
Landed cost per accepted unit
Creates the purchasing baseline
Include freight, duties, and rejected units consistently
Filling labor
Operator time and throughput by batch
Shows whether the format fits the production line
Compare under the same staffing and equipment conditions
Oil and process loss
Measured loss during filling, capping, storage, and handling
Connects hardware choice to saleable yield
Use the intended formulation and a defined observation period
Failure and support cost
Verified complaints, replacements, freight, and service time
Captures post-sale cost omitted from the quote
Separate hardware-confirmed failures from unrelated complaints
Internal link suggestion: cannabis vaporizer oil filling guide -> oil filling process and production controls
Validate Hardware Under the Intended Oil and Operating Conditions
A hardware sample becomes decision-grade evidence only when the test reflects the product that will actually be filled, stored, shipped, and used. Oil composition and viscosity, filling temperature, capping delay, storage orientation, ambient temperature, transport conditions, power settings, and draw behavior can all change the observed result. Recording those variables makes results comparable and prevents a successful informal sample from being treated as universal compatibility.
Define failure before testing. A practical protocol can distinguish visible leakage, airflow blockage, burnt or off-flavor reports, battery or activation failure, cosmetic damage, and fill-time variation. It should also record sample size, production batch, test duration, baseline device, and the person responsible for approving the result. A supplier specification describes a device; a controlled brand test shows whether that device fits a particular commercial program.
Strategy 2: Match Hardware Formats to Profit Tiers
The smartest operators are not trying to force one device to do every job. They are matching hardware formats to distinct margin roles. That logic is supported by current market behavior: Oregon reports that extracts and concentrates held a stable median retail price of $16.00 per gram in both 2023 and 2024, while flower kept sliding under oversupply pressure.
That comparison shows price stability for Oregon’s extracts-and-concentrates category during a defined period; it does not prove that every processed format, vape SKU, or hardware platform protects margin. A useful portfolio architecture therefore assigns a role first and validates it with brand data. Each SKU should have one primary job, a defined audience and oil, a measurable KPI, and a rule for scaling, revising, or retiring it.
Portfolio role
Primary decision
Useful evidence
Review question
Premium experience
Whether the hardware, oil, and design support a differentiated offer
Price realization, contribution margin, complaint cost, and controlled product testing
Does the SKU earn its added complexity after all costs are included?
Core volume
Whether the format can operate predictably at the intended production scale
Throughput, accepted yield, inventory turns, supply performance, and failure cost
Does the platform remain economical per saleable unit?
Trial or innovation
Whether a new format deserves a controlled market pilot
Small-batch sell-through, buyer feedback, support burden, and upgrade behavior
What evidence would justify scaling the experiment?
Strategy 3: Use Industrial Design to Defend Price Perception
Price wars are hardest on brands that look interchangeable. Industrial design can create a faster signal of difference, but the commercial effect should be tested in the intended channel rather than assumed. McKinsey’s 2025 consumer research found Gen Z was the surveyed generation most willing to splurge. The research covered multiple countries and consumer categories, so it supports a design-testing hypothesis—not a conclusion about cannabis-device price premiums.
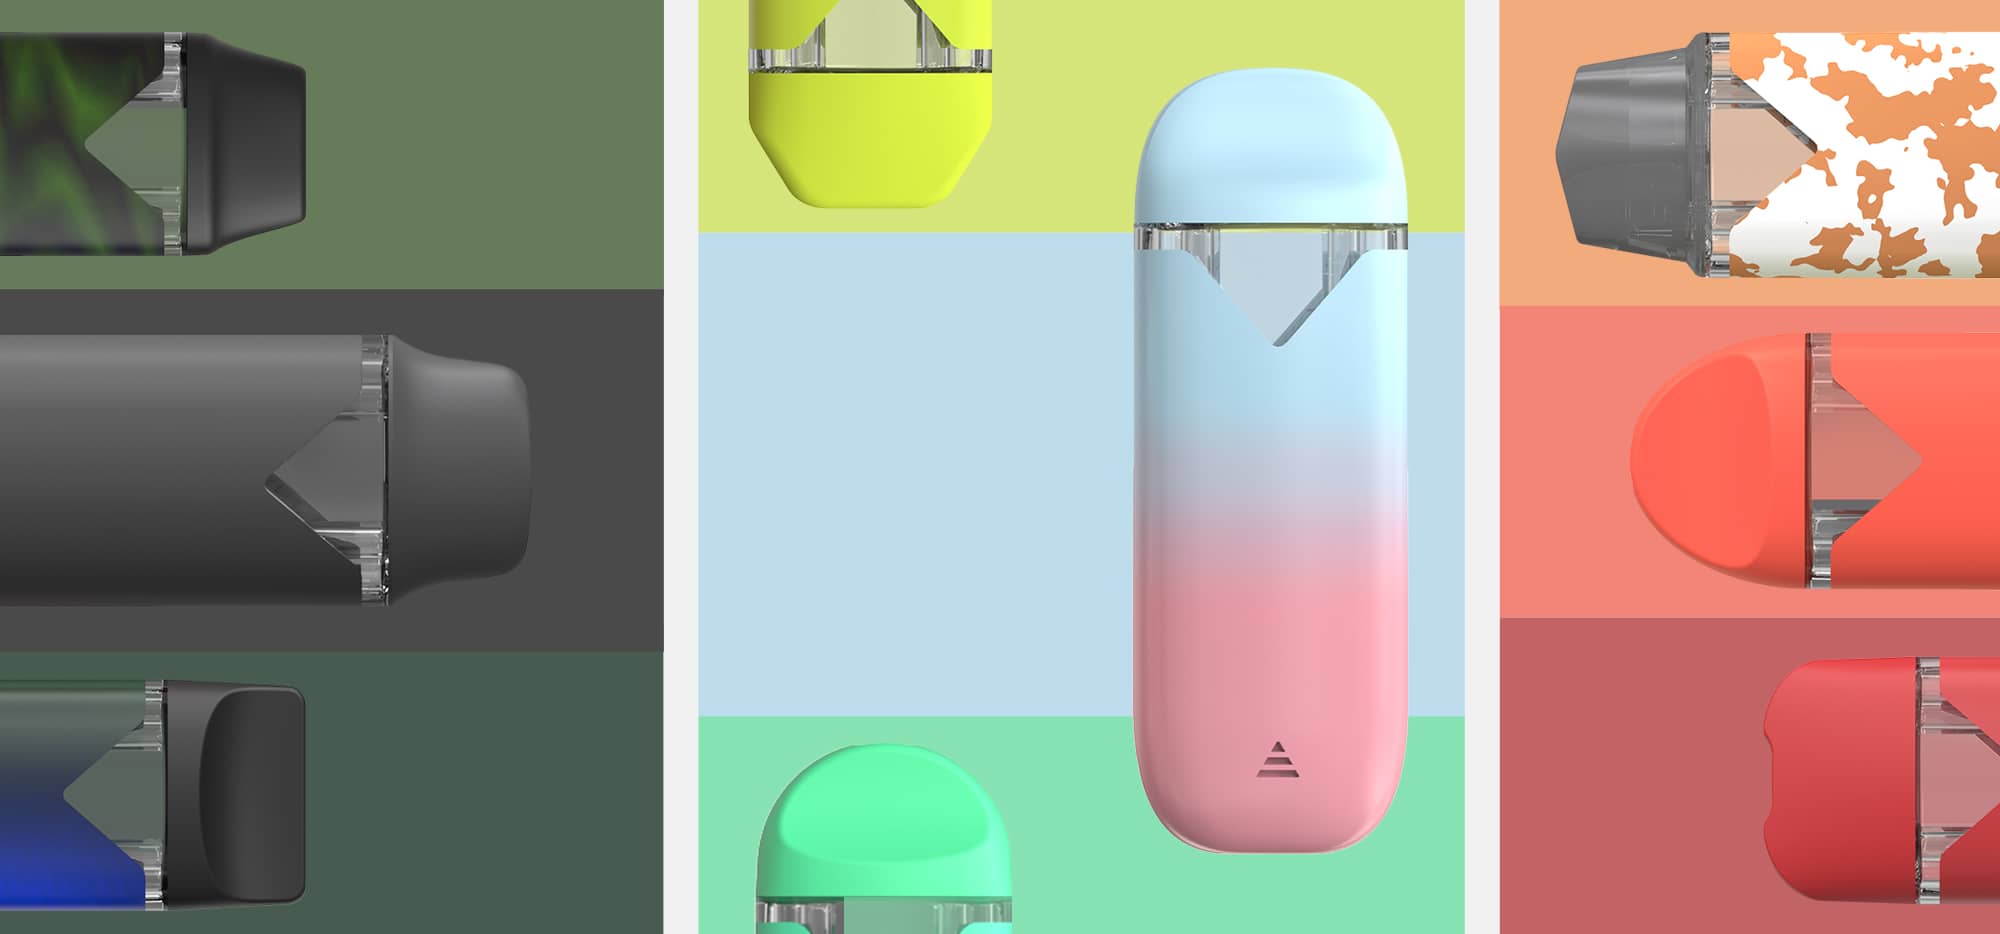
Material feel, finish, translucency, weight balance, and silhouette all shape whether a device looks disposable or desirable. Brands can evaluate those signals through shelf mockups, menu thumbnails, buyer reviews, or target-consumer concept tests. Recognition, perceived quality, purchase consideration, and expected price can be measured separately, making it easier to see whether a design direction creates useful differentiation or simply adds cost.
Soft-touch refinement: skin-feel coatings, warmer neutrals, and lower-gloss finishes that signal comfort and premium tactility.
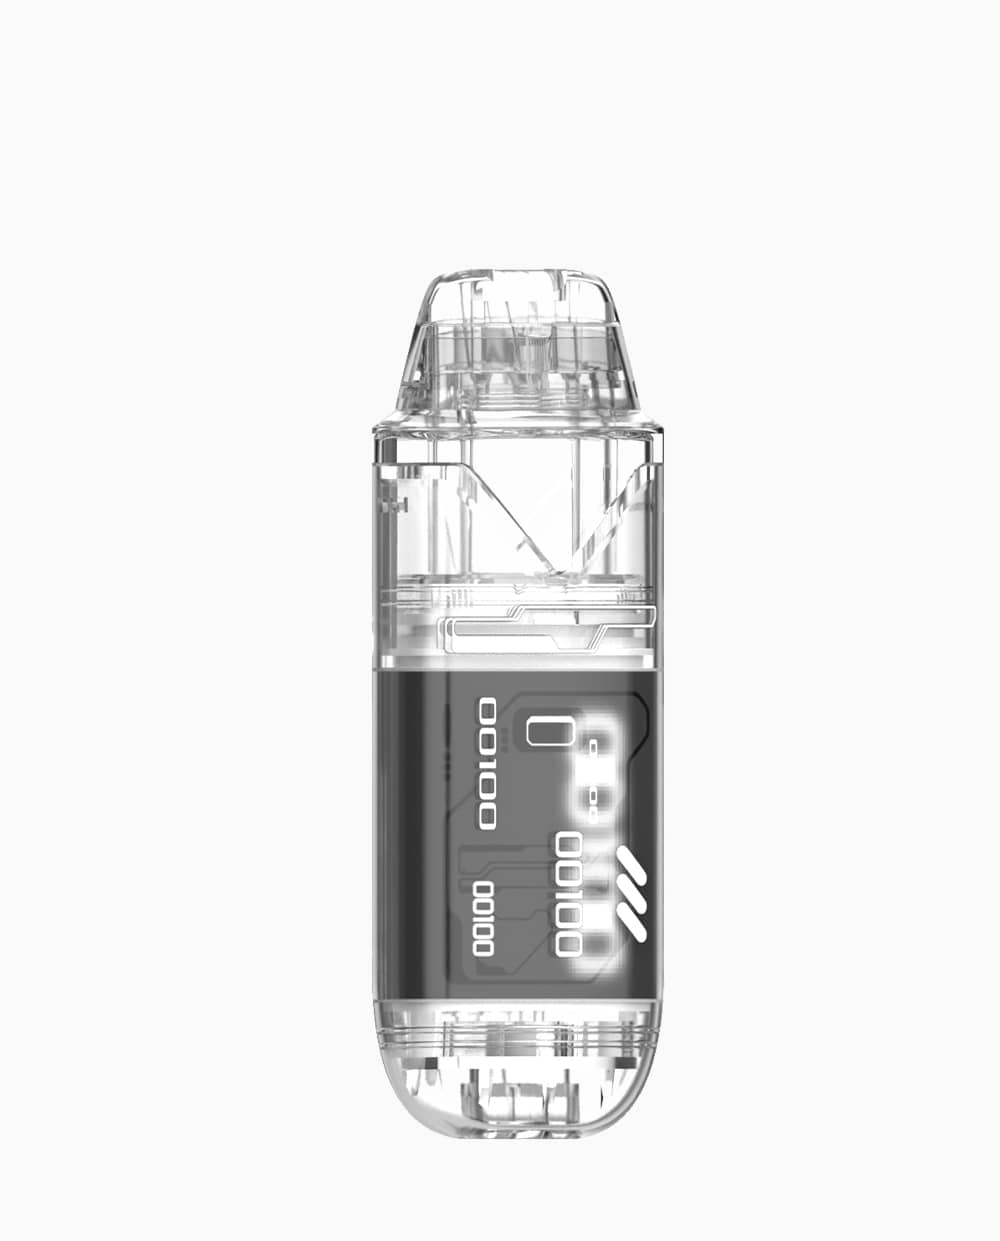
Translucent industrial styling: semi-transparent shells, visible internal geometry, and technical detailing that make the device feel engineered rather than generic.
Controlled color contrast: bold but disciplined CMF combinations that create instant shelf recognition without drifting into novelty-only branding.
Operator Checklist: Audit Your Vape Portfolio Before the Next Price Cut
Before reducing retail price again, operators should review whether each vape SKU has a clear margin function.
Which device protects premium oil quality and reduces complaint risk?
Which device is designed to drive repeat purchase and daily carry behavior?
Which device anchors broad-market volume with predictable sourcing and compatibility?
Where are leaks, clogs, slow filling, oil waste, or replacements eroding real margin?
Does the design language make the product look worth its target price at first glance?
Are product tiers clearly separated, or are multiple SKUs competing for the same role?
Turn the answers into a scorecard with nine fields: SKU, target user, intended oil, primary portfolio role, TCO per saleable unit, validation status, failure cost, decision owner, and next review date. If the role is unclear, consider consolidation. If the evidence is incomplete, keep the device in a limited pilot. If the role, operating results, and economics all meet the brand’s predefined threshold, move it to a scale review.
Where Artrix Hardware Can Enter the Evaluation
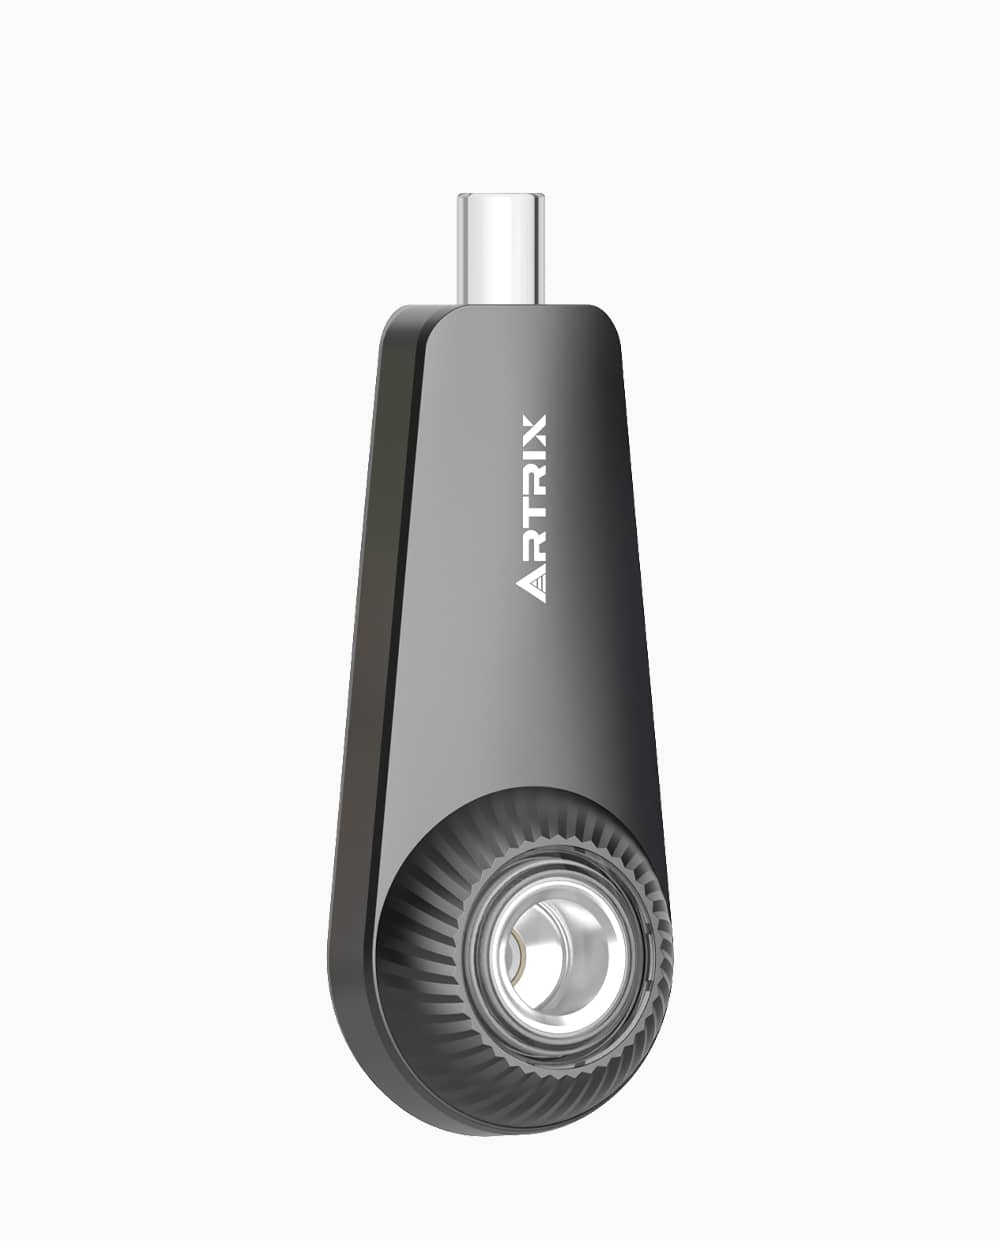
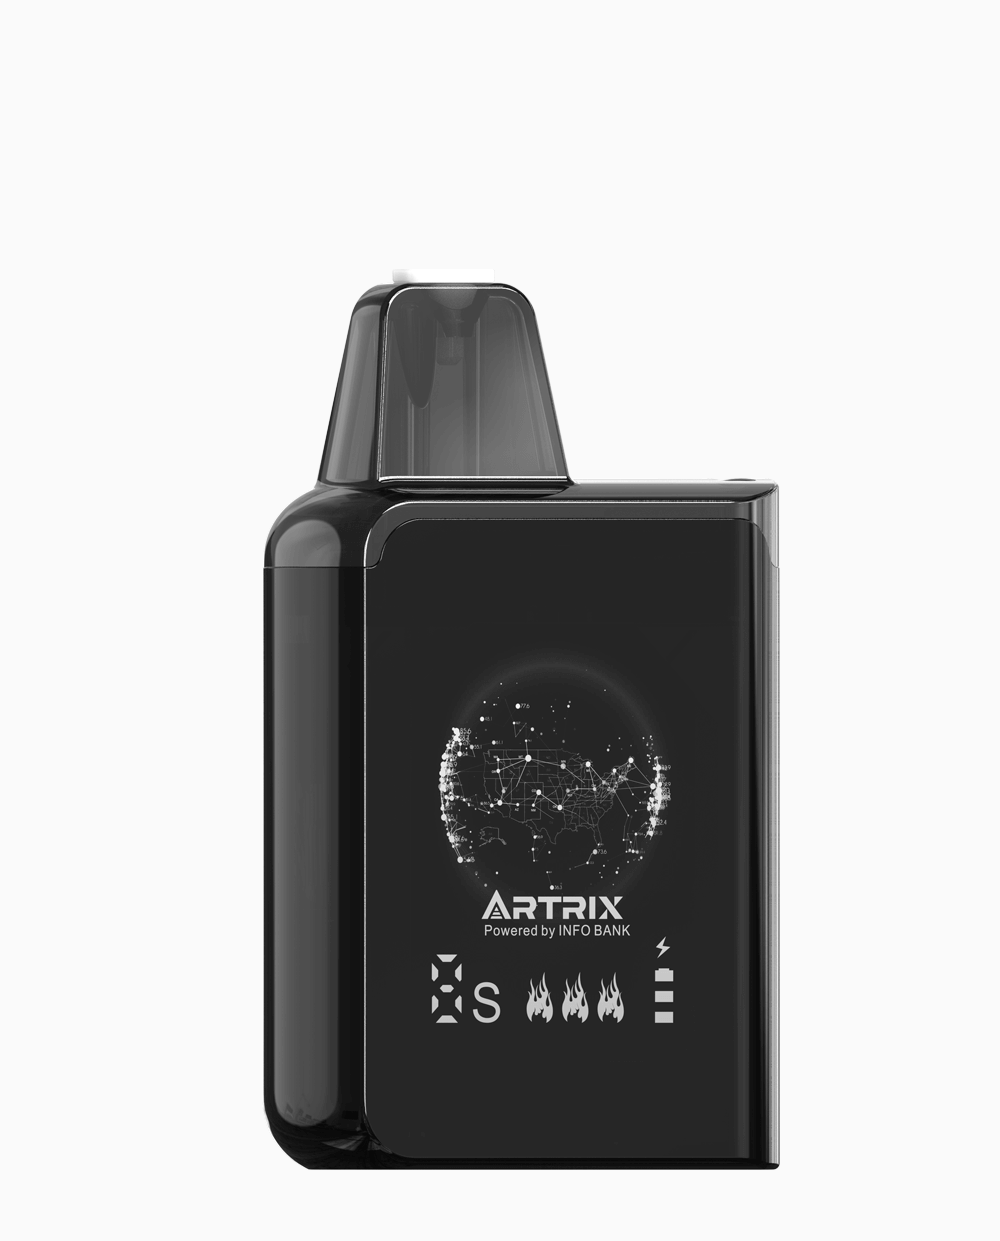
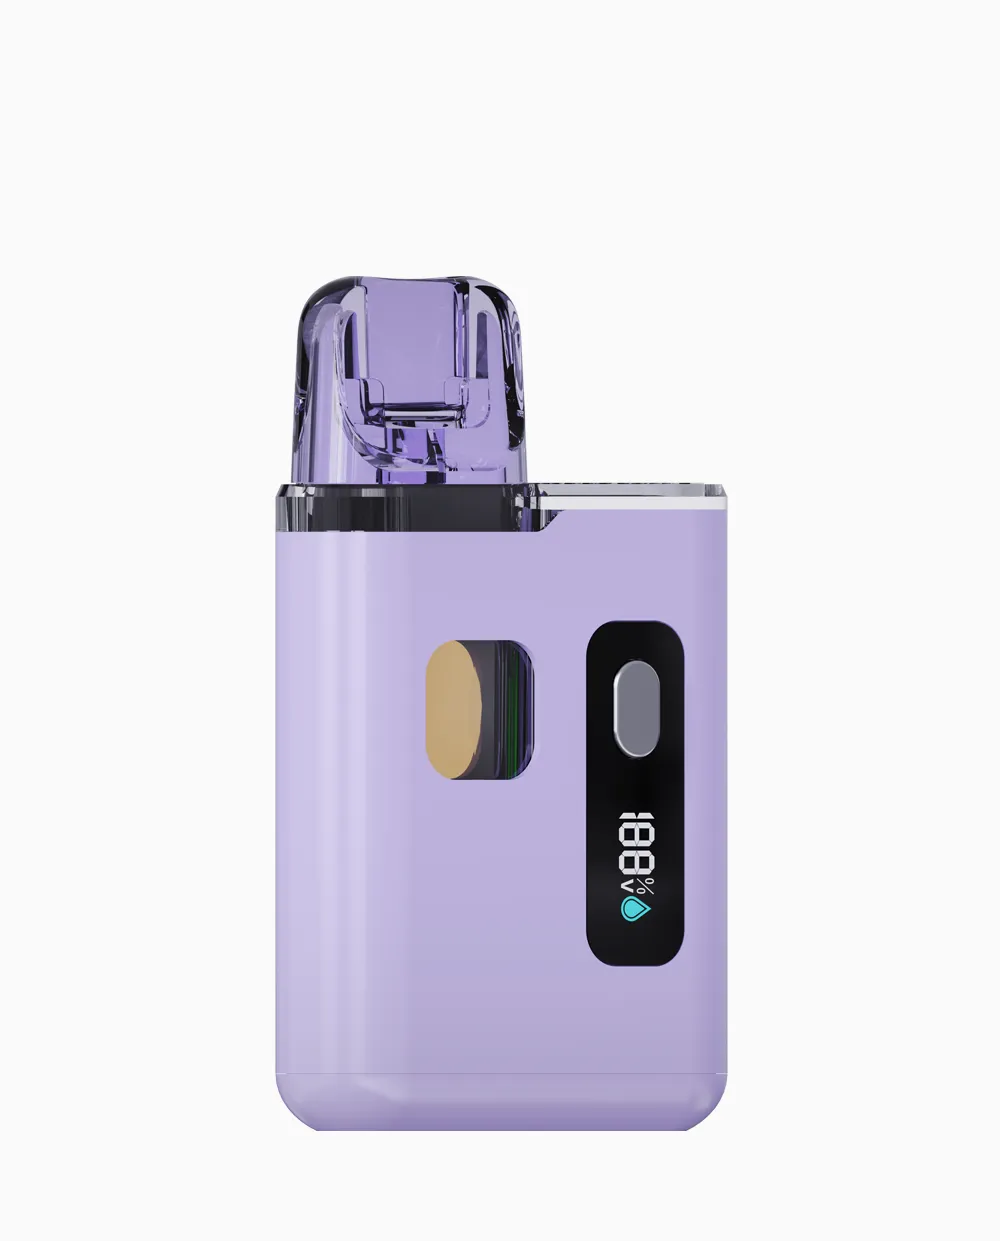
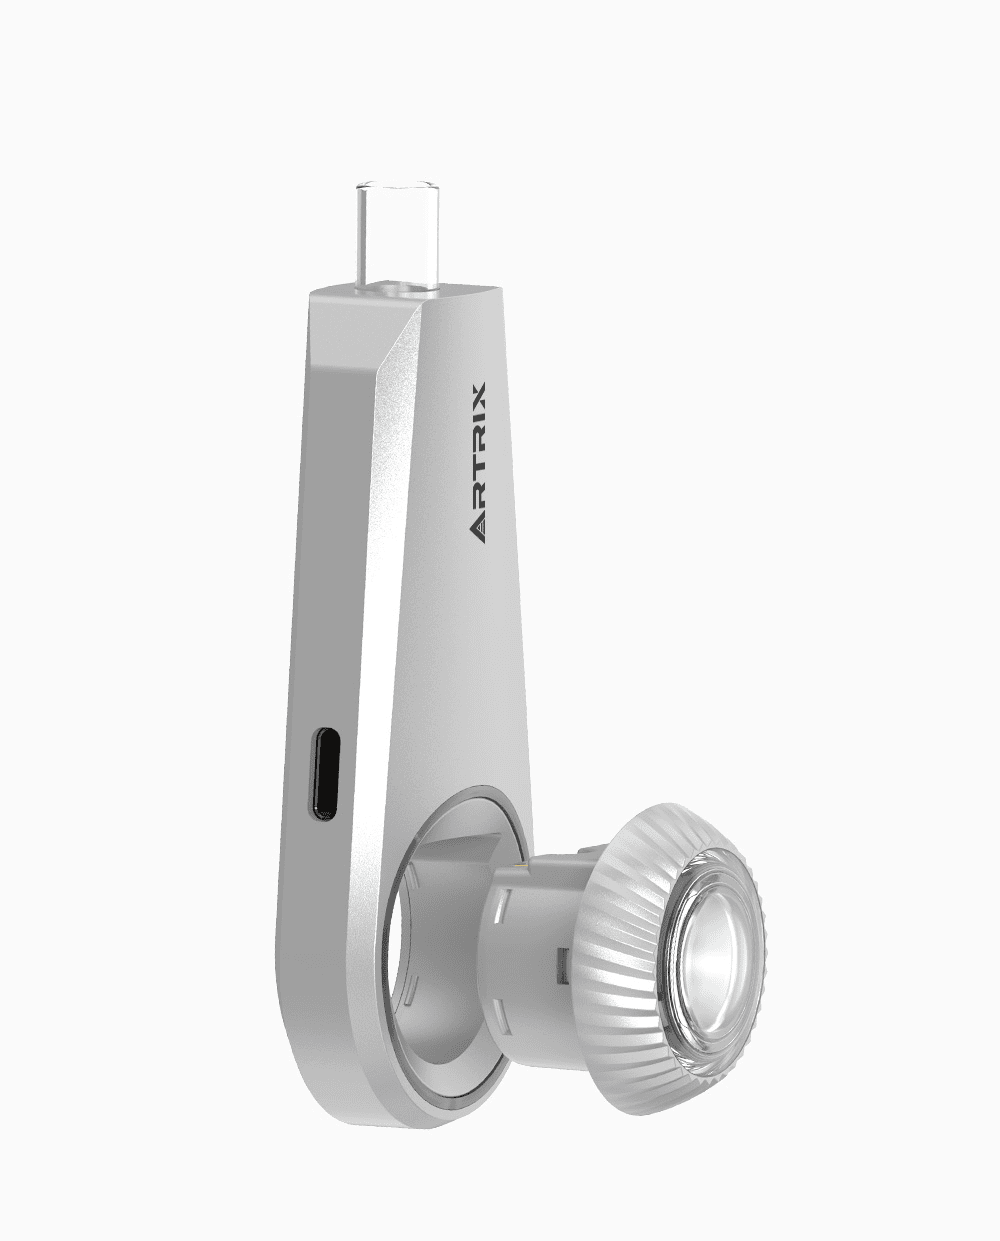
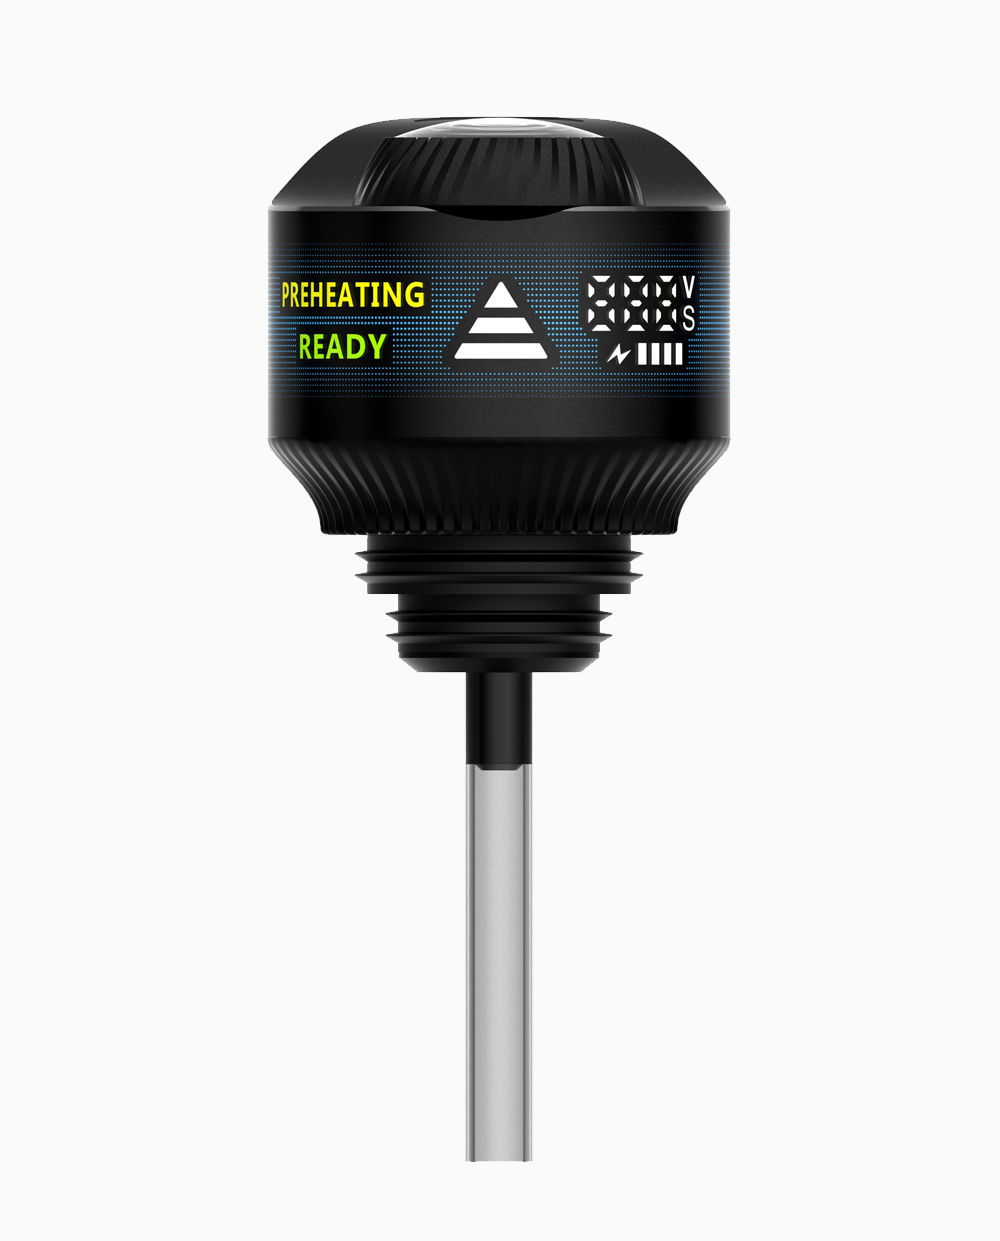
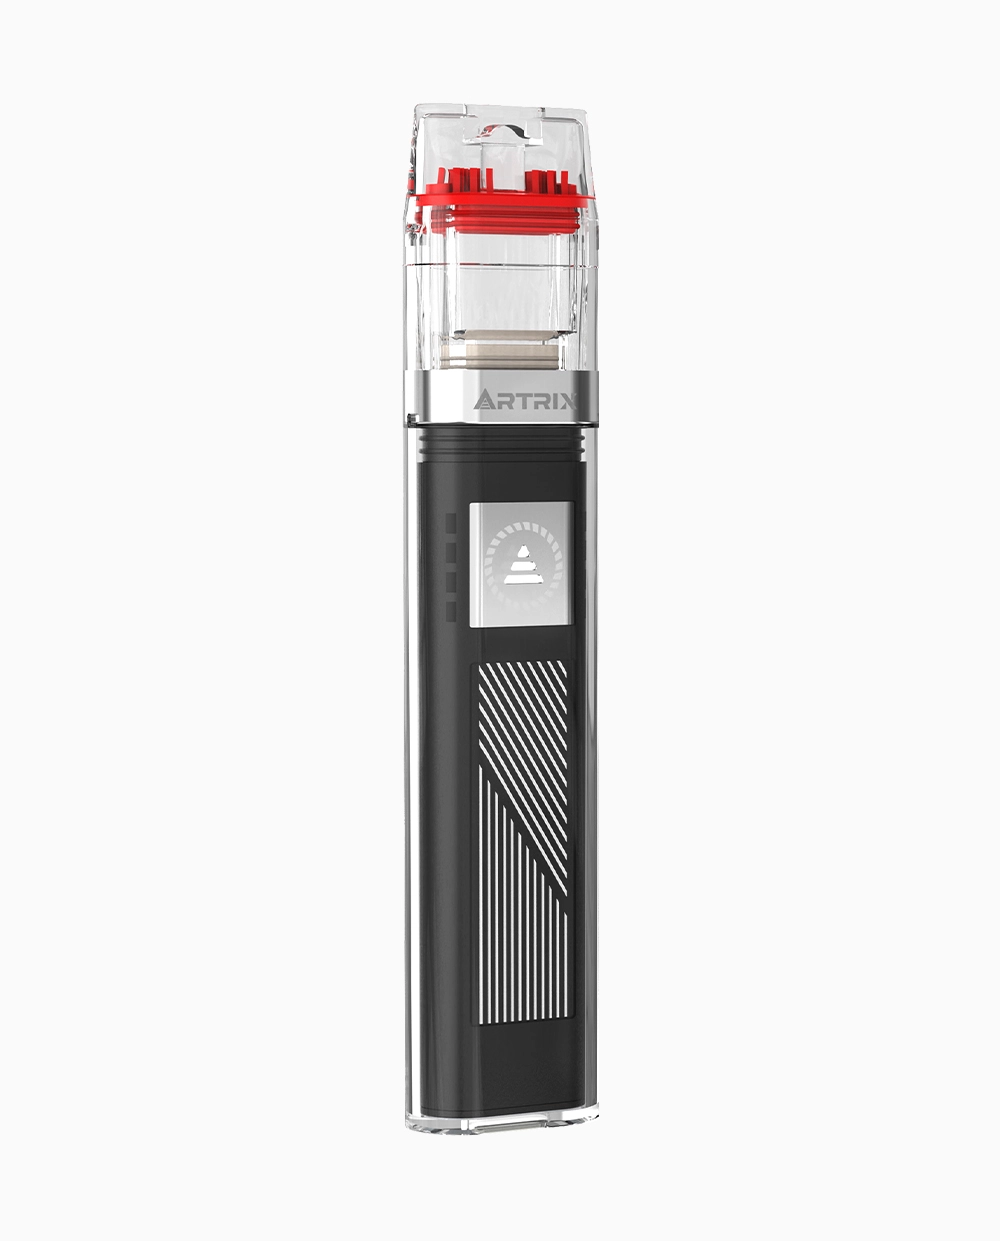
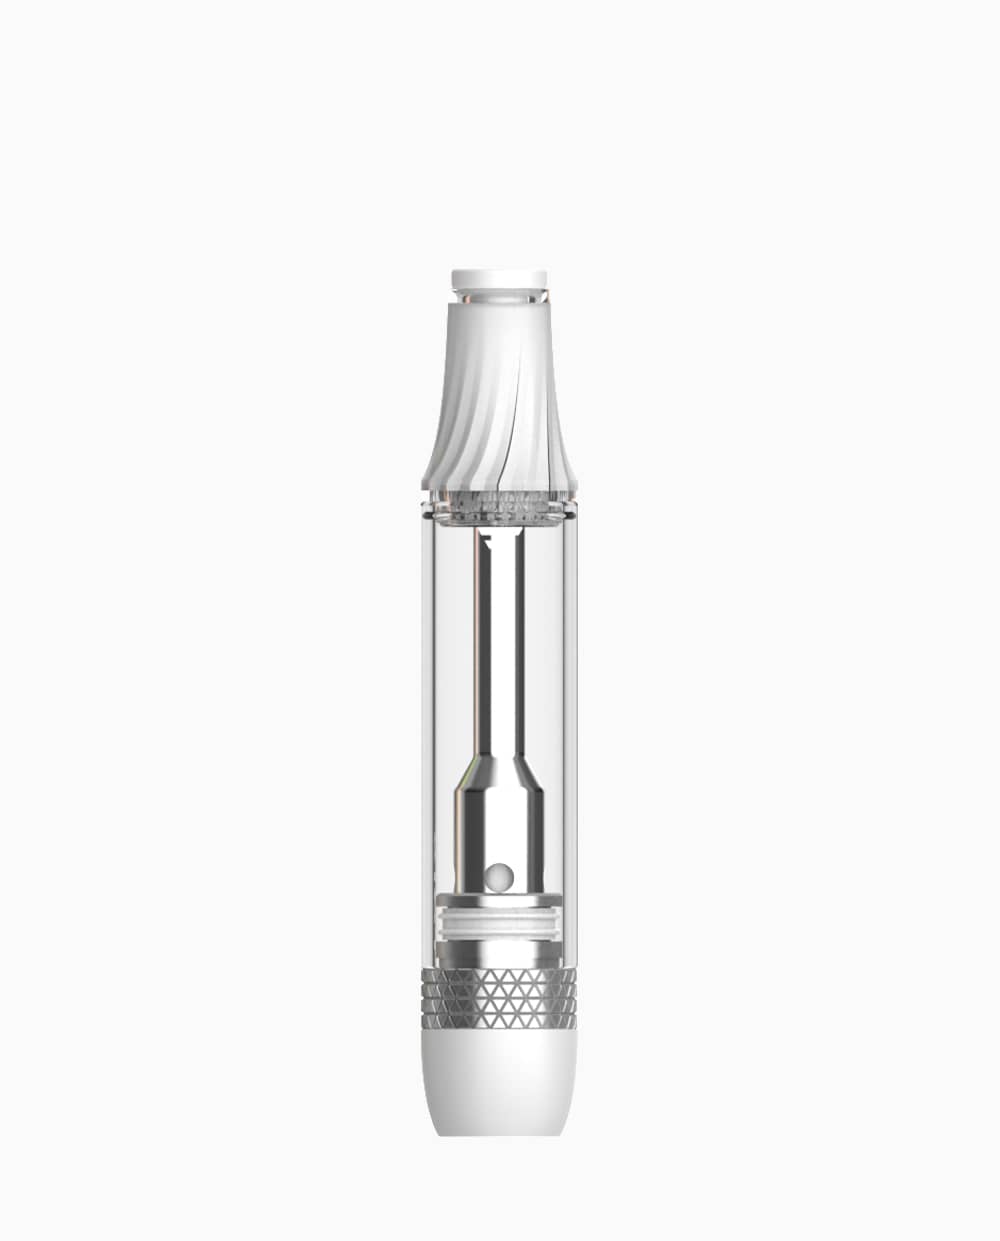
Artrix products can be evaluated as candidates within this framework, not as predetermined profit outcomes. The Influx lists a 1 mL or 2 mL disposable platform with low-power settings, an extended ceramic core, dual airflow, a display, and positioning for live resin and rosin. Those published features make it a relevant candidate for a premium-extract validation plan, while oil compatibility, sensory consistency, production fit, failure behavior, and commercial performance still require brand-specific testing.
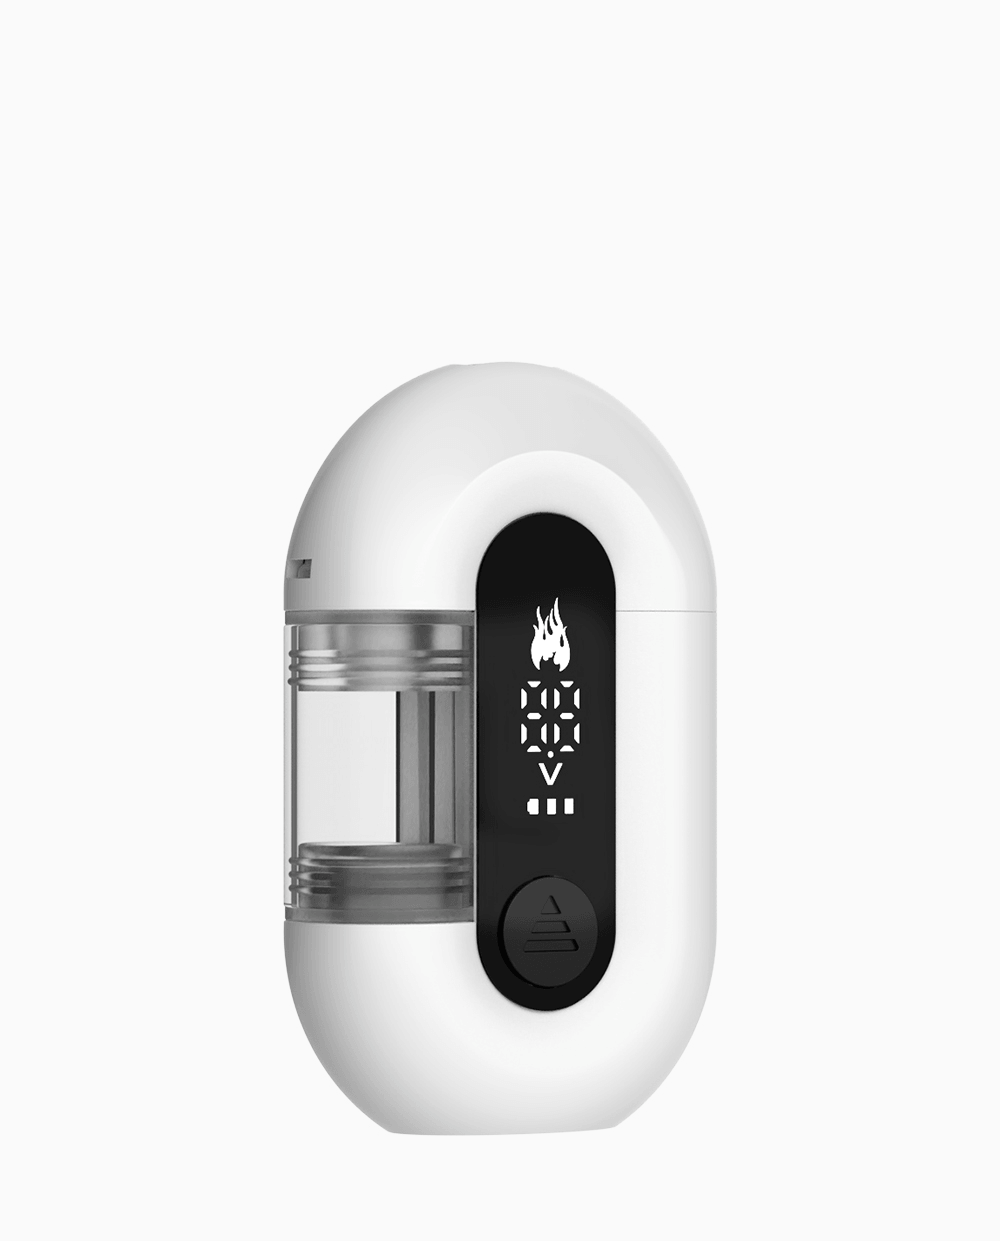
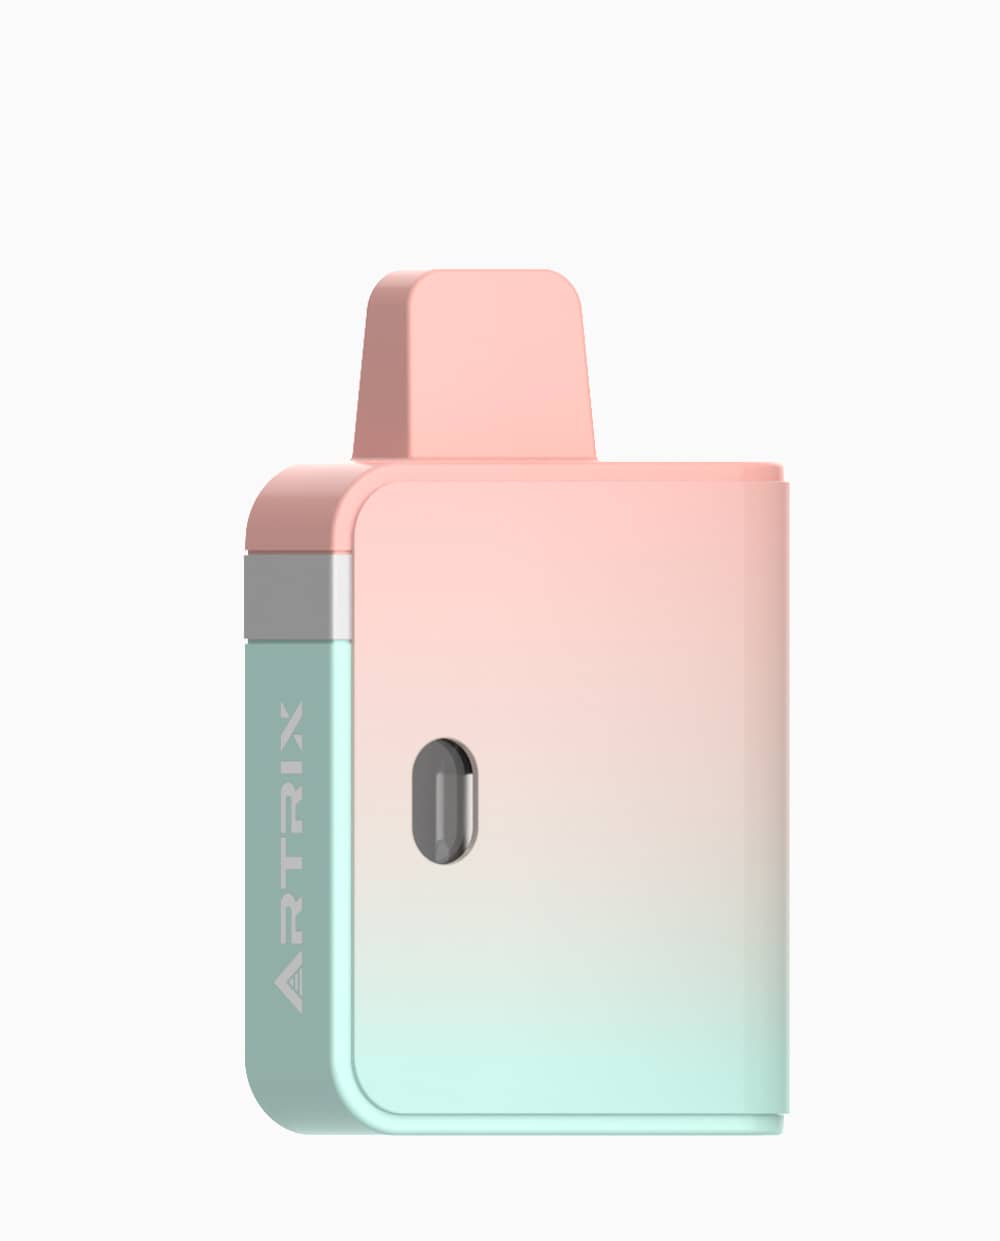
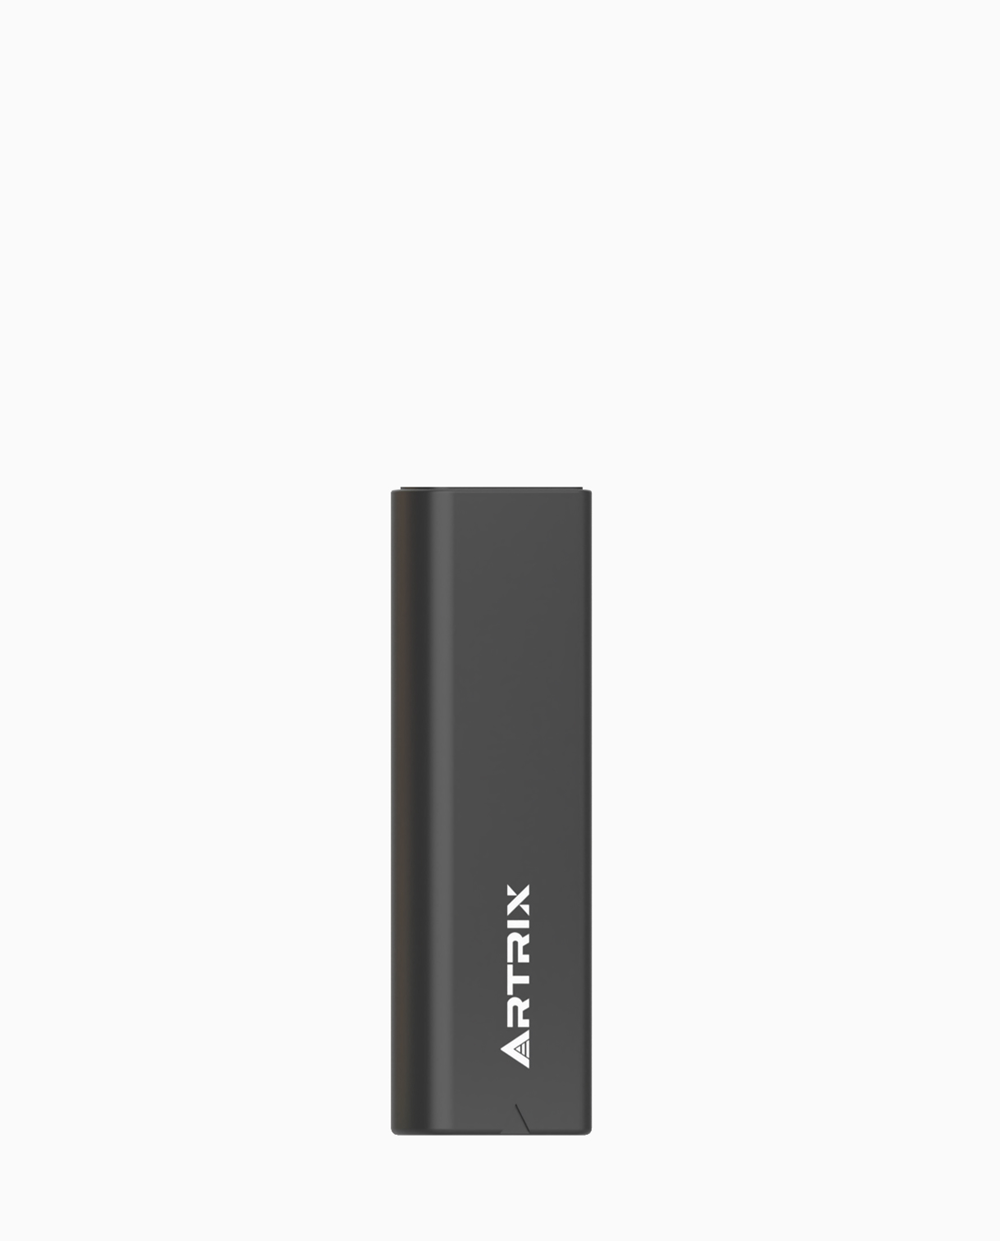
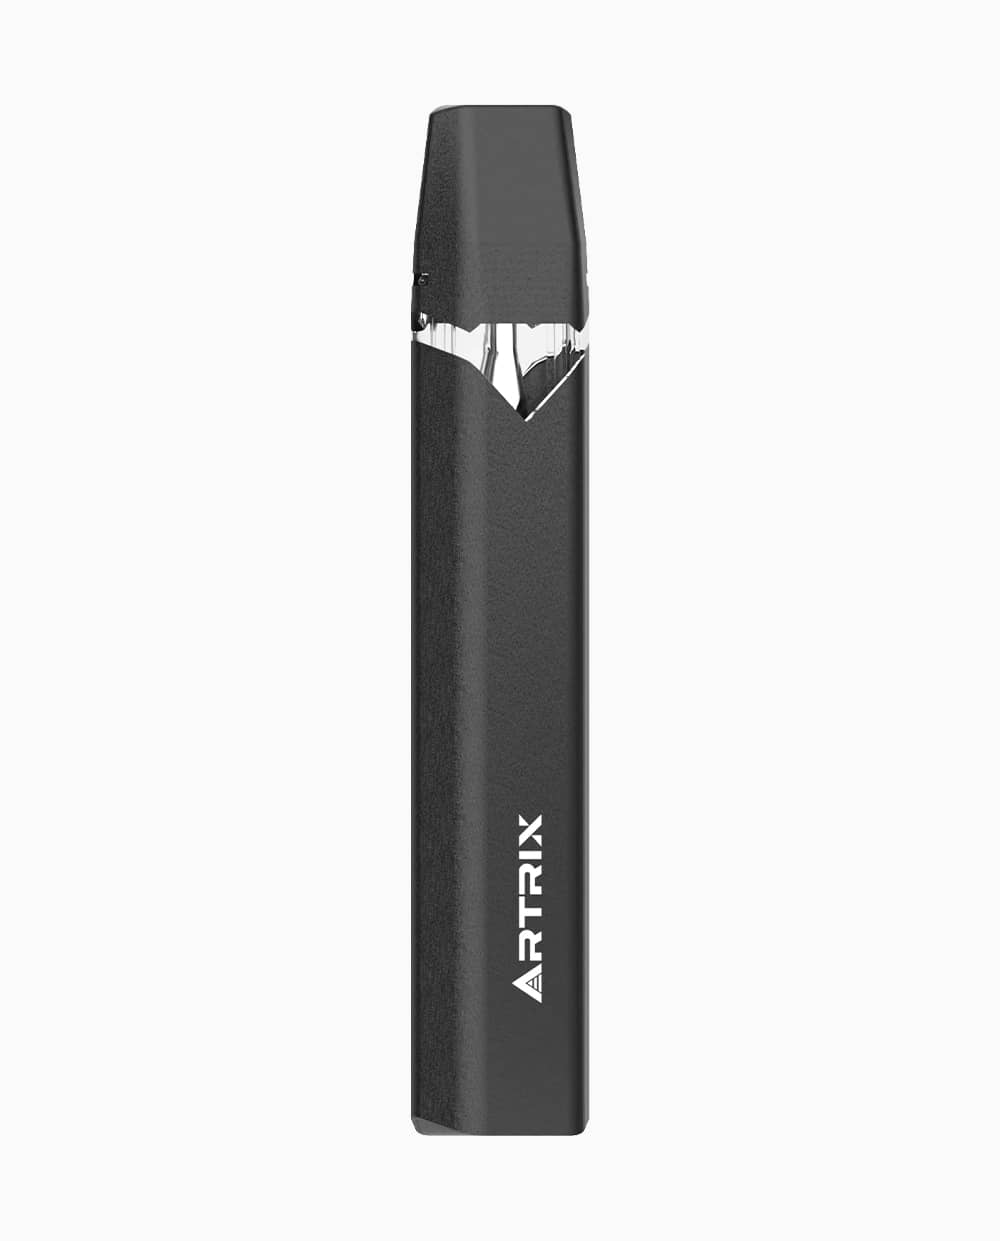
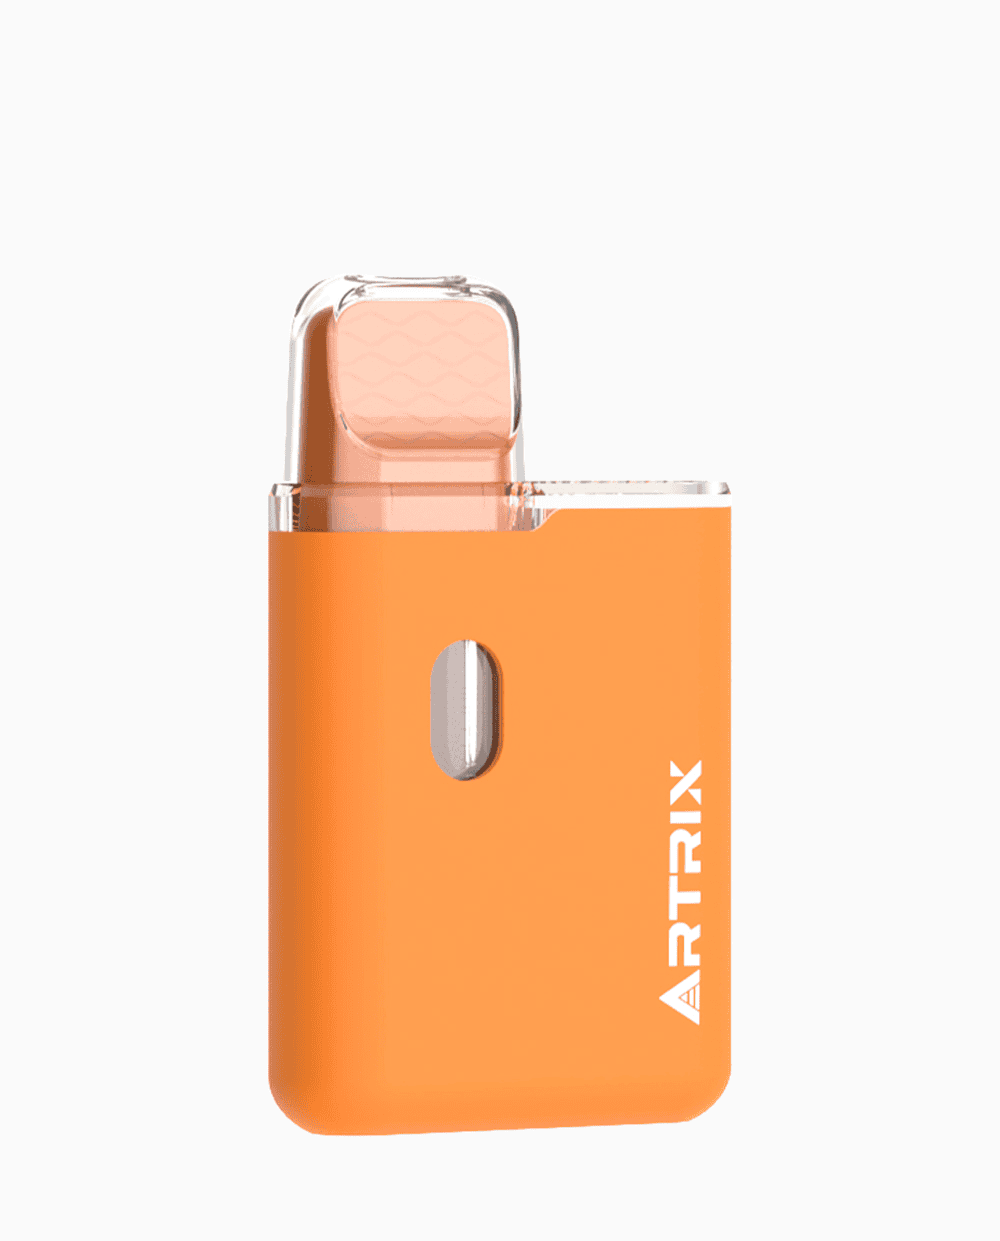
LilCube is listed as a compact 0.5 mL or 1 mL all-in-one format with an aluminum-alloy body and published compatibility that includes live rosin, live resin, liquid diamond, rosin oil, and distillate. That makes it more accurate to discuss LilCube as a solventless- and extract-oriented candidate than as an assumed entry-tier LTV builder. Its portfolio role should follow the intended formulation, target price, TCO, and observed repurchase data.
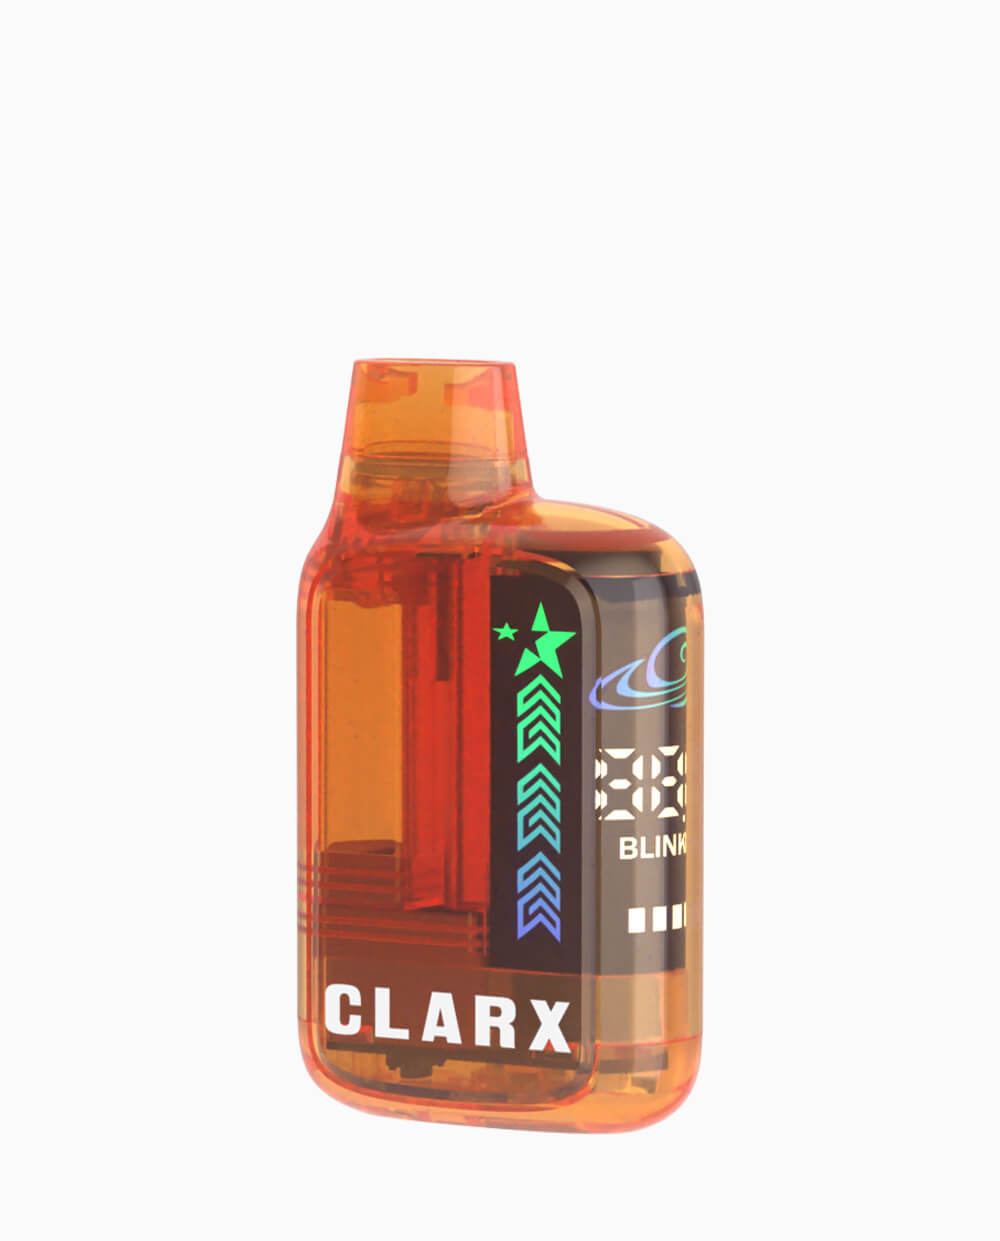
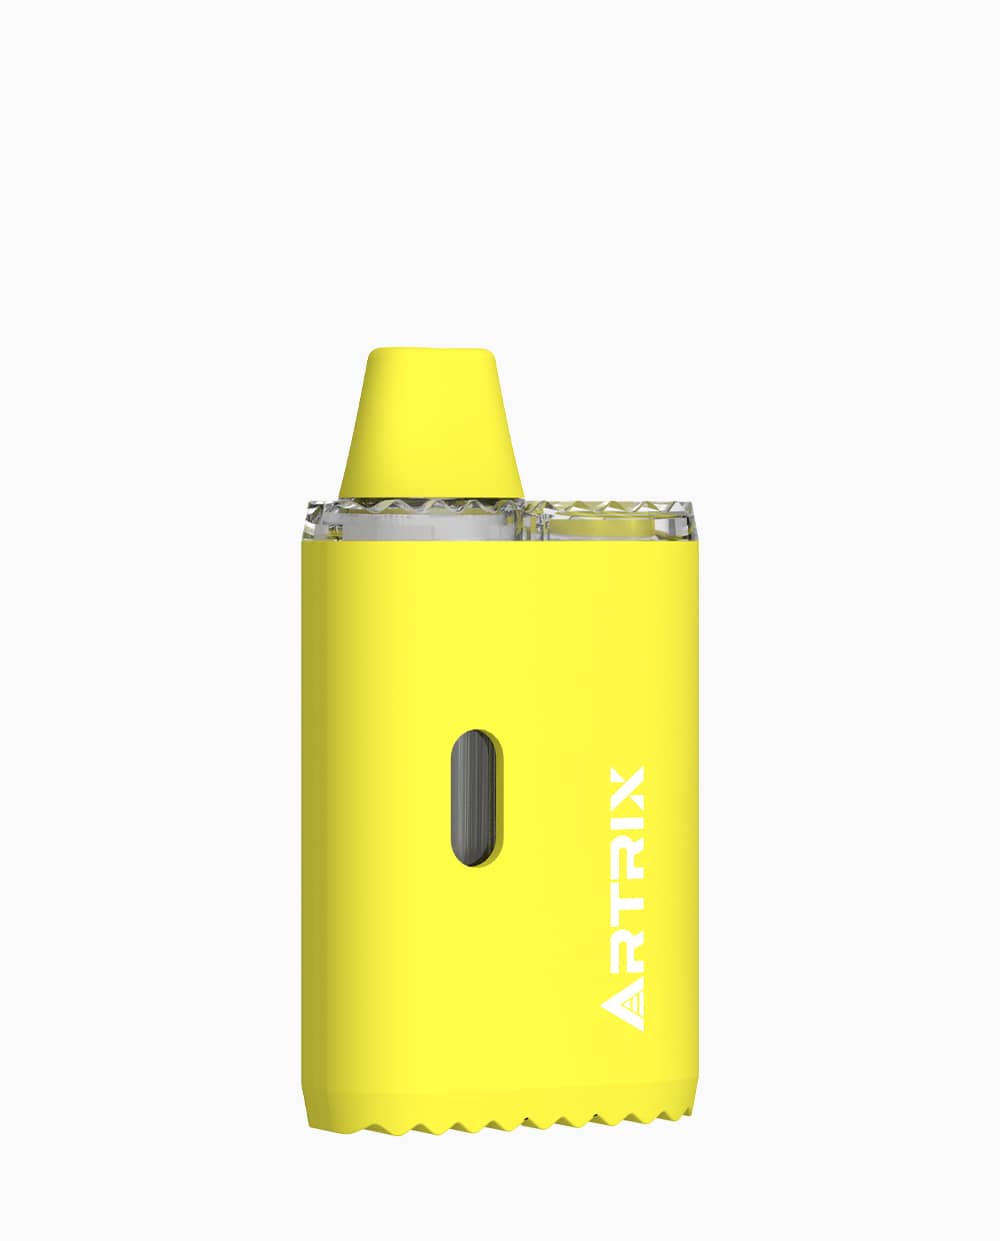
Cubox is a 1 mL or 2 mL all-in-one box vape with a 300 mAh battery, buttonless operation, and a published cannabinoid and live-resin compatibility list. It should not be described as a 510-compatible platform. A brand considering Cubox for a core-volume program can assess filling space, production throughput, accepted yield, supply terms, complaint cost, and sell-through before assigning it a cash-flow role.
Internal link suggestion: request vape hardware samples -> Artrix sample or contact page
Conclusion: Profitability Comes from Better Margin Architecture
To stay profitable during cannabis price compression, brands need to stop asking how to survive cheaper markets and start asking how to design for margin inside them. The practical sequence is clear: calculate TCO per saleable unit, test hardware with the intended oil and operating conditions, assign each SKU one measurable role, and validate whether industrial design changes value perception before scaling.
Price compression rewards brands that know exactly where profit is made and where it is lost. In cannabis vape, that means hardware is no longer a back-office purchasing decision. It is one of the clearest levers for margin defense, product differentiation, and long-term brand resilience.
Sylph Wu is the digital marketing manager at Artrix. In the cannabis vaporization sector, she has honed her expertise in social media management, SEO optimization, paid advertising, and EDM campaigns. By blending her passion for cannabis culture with strategic marketing efforts, Sylph has driven Artrix’s brand visibility and consumer engagement in line with market trends.




-1.webp)
-1.webp)
-2.webp)